Contents
- Index
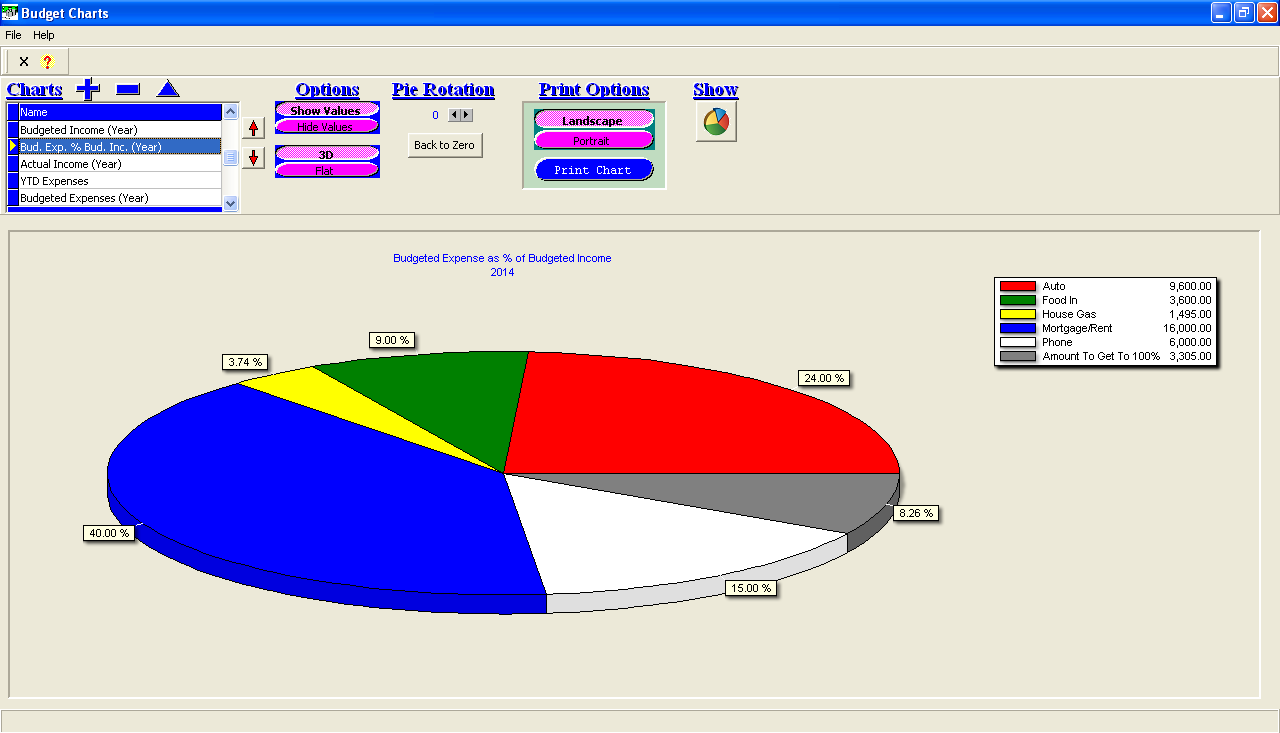
Budget Charts
This screen will allow you to create, view, and print pie charts for your budgeted items.
How to Use
Begin by defining a chart. The following steps will create a chart based on overall annual budgeted expenses as a pertentage of overall annual budgeted income.
1. Click the  button. This will open up the Budgets Chart Definition screen.
2. Input "Bud. Exp. % Bud. Inc. (Year)" as the Name.
3. Input "Budgeted Expense as % of Budgeted Income" as the Title.
4. Under Amount to be Charted, select "Budget Year: Budgeted Amount" from the drop-down field.
5. Under Amount to be Charted, select Expenses in the group box.
6. Under Amount is to be a Percentage of, select "Budget Year: Budgeted Amount" from the drop-down field.
7. Under Amount is to be a Percentage of, select Income in the group box. Your screen will look like this:
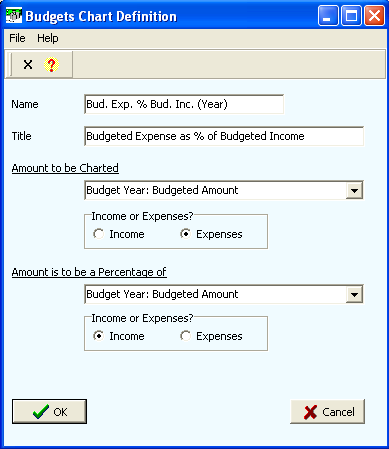
8. Click the OK button.
To view the chart you just created, click the  button.
Options
Show Values / Hide Values
Data value labels may be displayed for the pie segments of the chart. A percentage will always be displayed.
3D / Flat
Charts may be displayed either three-dimensionally or two-dimensionally.
Pie Rotation
Use the corresponding arrows to rotate the pie to the desired vantage point. (This is helpful for when value labels overlap each other.)
Printing Charts
Any chart may be printed on any type of printer. Charts will be printed to span the entire page. Charts may printed in either a portrait or a landscape fashion.