Contents
- Index
Budgets Chart Definition
This screen is used to define a pie chart.
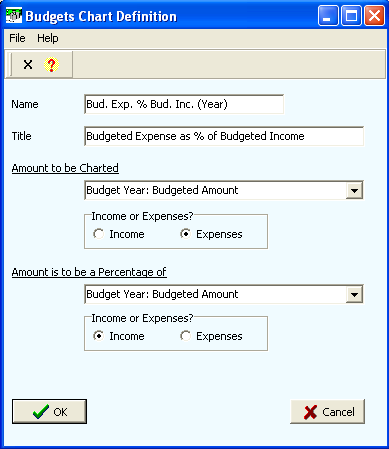
Name: The name of the chart (up to 30 characters). This displays in the Charts grid.
Title: The title of the chart when it displays (up to 50 characters).
Amount to be Charted: This represents the amounts for the categories that will make up the pie segments. The fields available are:
Budget Year: Budgeted Amount. This is from the "Budgeted Amount" column of the annual budgets grid.
Budget Year: Actual Amount: This is from the "Actual Amount" column of the annual budgets grid.
Budget Month: Monthly Budgeted Amount: This is from the "Monthly Budgeted Amount" column of the monthly budgets grid.
Budget Month: Monthly Actual Amount: This is from the "Monthly Actual Amount" column of the monthly budgets grid.
Budget Month: YTD Budgeted Amount: This is from the "Year to Date Budgeted Amount" column of the monthly budgets grid.
Budget Month: YTD Actual Amount: This is from the "Year to Date Actual Amount" column of the monthly budgets grid.
Amount to be a Percentage of: This represents the amounts for the categories for which the Amount to be Charted will be a percentage of. The fields available are the same as above.
Important Note
Pie chart percentages are calculated as Amount to be Charted divided by Amount to be a Percentage of. Pie charts must equate to 100%. If the Amount to be a Percentage of is greater than the Amount to be Charted, then the pie chart cannot be shown due to the fact that the segments of the pie chart cannot exceed 100%. When this happens, you will get a message stating such and the chart will not be shown.
If the Amount to be Charted is less than the Amount to be a Percentage of, then you will see a pie segment called, "Amount To Get To 100%". This represents the difference between the Amount to be Charted and the Amount to be a Percentage of tallies. Again, a pie chart must equate to 100%.